2025 Property Tax Rates
2025 Property Tax Rates
The Issue
March 6, 2025
Greetings Commissioners of Surry County,
We are writing to you in regards to the drastic increase in property tax values across Surry County. Due to the decrease in the median household income, high inflation, and relatively high interest rates, we the people of Surry County feel that the new market values are somewhat unwarranted, and that factors outside of “market price” were not considered in the new evaluations.
As you are aware, Surry County has been designated a Tier 1 County for economic distress in 2025 by the North Carolina Department of Commerce, a change from the Tier 2 (less distressed) designation in 2024. The driving force for this change in designation was the decrease in the median household income (County Distress Rankings). As seen below in Figure 1, the Adjusted Property Tax Base Per Capita has been on a steady increase from 2019 to 2024, with an average rate of increase of 5.32% over five years, with a maximum increase of 7.12% in 2021. As also seen in Figure 1, that increase jumped in 2025, with a calculated percent increase of 14.1%, increasing the average to 7.51% over a five-year period (2020-2025). The Median Household Income between 2016 and 2022, had an average increase of 7.9%, with a maximum of 20.0% increase in 2017. We should note that we are using numbers from 2016-2022 since these are the same years used for the median household incomes in the NC Department of Commerce reports (County Distress Rankings).
The inflation rate for 2022 was approximately 6.5% (Current US Inflation Rates), and the total inflation rate from January 2016 to December 2022 was 23.0% (Current US Inflation Rates). The cost of living has continued to drastically increase over the past three years. According to the United States Bureau of Labor Statistics’ Consumer Price Index (CPI) Calculator, $100 in January of 2022 has the same buying power as $107.00 in January of 2025 (CPI Inflation Calculator). That is an additional increase of 7% over three years, or a total increase of 30% from 2016 to 2025. An additional increase to an already 30% more expensive cost of living, will put hardships on families as well as citizens on fixed incomes.
Using an equation that converts actual wages to real wages based on the inflation rate of that year (Koelling), as seen in Table 1 below, the real wage for 2022 is $34,207.51, compared to the actual wage of $48,524.00. This is $1,635.49, or 4.5%, lower than the actual and real median household income in 2016. When comparing the Adjusted Property Tax Base Per Capita to the Real Median Household Income, as seen in Figure 2 below, the trendlines diverge between the buying power of the citizens of Surry County and the tax values of their properties.
We are aware that the State Legislature requires properties to be re-evaluated every eight years at a minimum, and that property tax values have to be as close as possible to the actual market values in the time they are appraised (Denning). However, the market values of the homes and properties in Surry County are artificial. There is currently a real estate bubble. Interest rates are relatively high, compared to three to four years ago. Under normal circumstances, when interest rates rise, home prices decrease due to the decrease in demand. It is clear that this did not happen in Surry County. Interest rates rose, and in most cases, market prices of homes continued to increase. As can be found in the reports from the NC Department of Commerce, summarized in Figure 3 below, there has not been a surge in population growth in Surry County (County Distress Rankings). Since there has not been a drastic increase in the population of Surry County, there is not a real housing shortage. Due to higher interest rates, homeowners that bought their home two to three years ago are holding on to their homes to avoid buying another home at a higher interest rate and a higher price. This has created an artificial shortage and increased the “market value” of homes across the county. Additionally, a majority of the homes that had a significant increase in property tax value (i.e. greater than the 5.32% average between 2019-2024) were not physically upgraded/remodeled to warrant such an increase in value. This further proves that the “market values” listed on the property tax re-evaluations are artificial.
We understand that Surry County’s needs become increasingly expensive each year, such as the cost to build/renovate schools, increasing from $242 per square foot in 2020 to $402 per square foot in 2025 (Surry County Board of Retreat). We also realize that personnel, equipment, and maintenance costs increase each year for Surry County. We, as tax paying citizens of this County, do not want to hinder the County from efficiently performing the functions that it is meant to perform. Therefore, we request that the County re-evaluate the tax rates for each district and lower them so that the average increase in the Adjusted Property Tax Base Per Capita for 2025 is equal to 7% instead of the drastic 14.1%. We feel that this is the fairest resolution for both parties. This would still allow the County’s budget to increase, and unburden the citizens of Surry County from such a large increase in taxes, especially those with families and those who are on a fixed income.
Tables and Figures
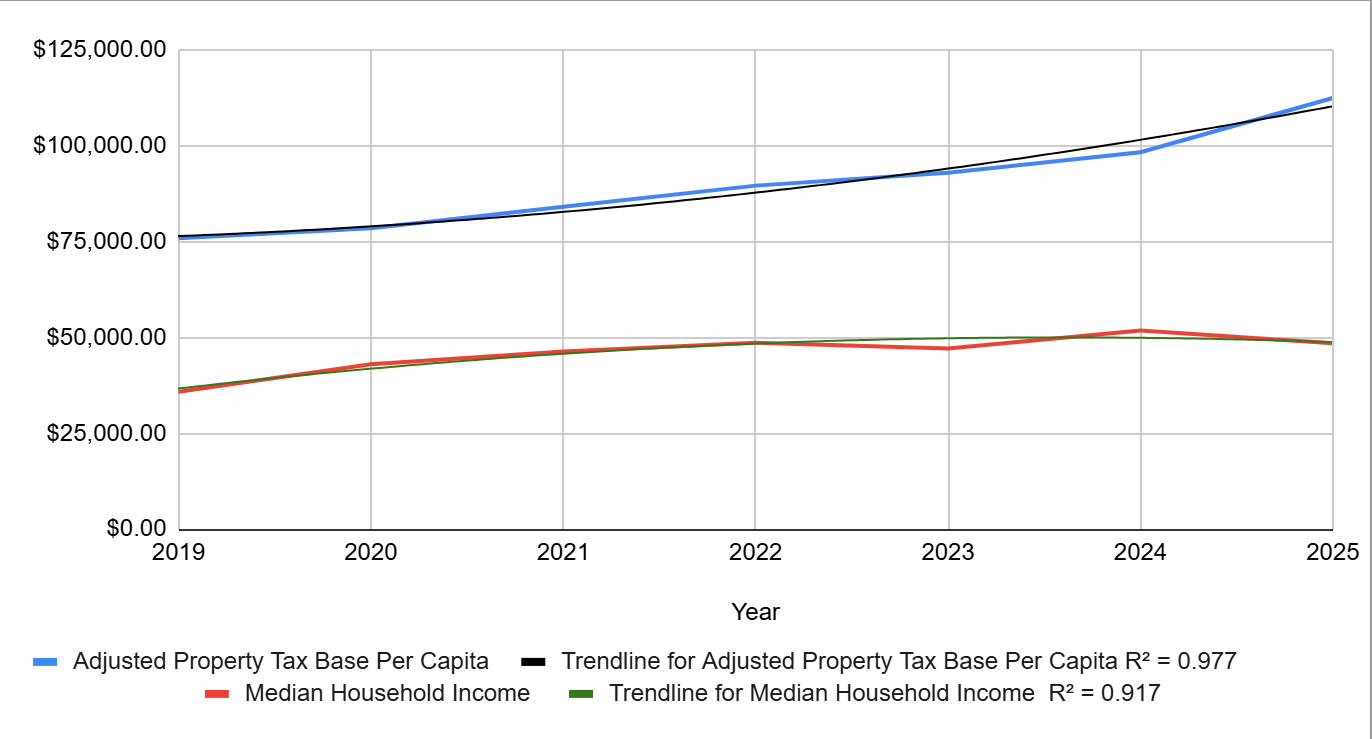
Figure 1 - Adjusted Property Tax Base Per Capita vs Median Household Income
Table 1 - Adjusted Median Household Income for Inflation (Real Income)
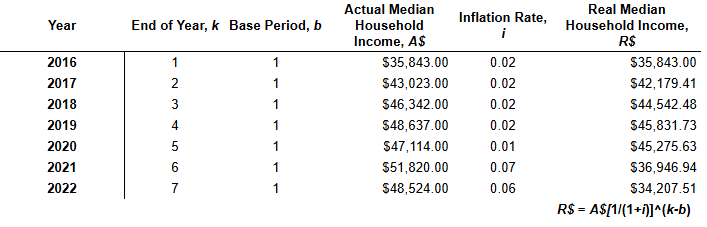
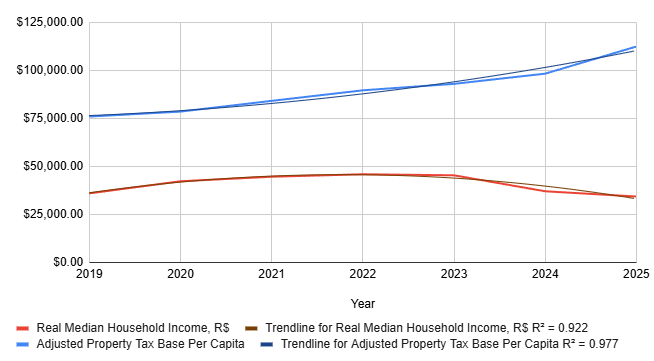
Figure 2 - Adjusted Property Tax Base Per Capita vs. Real Median Household Income
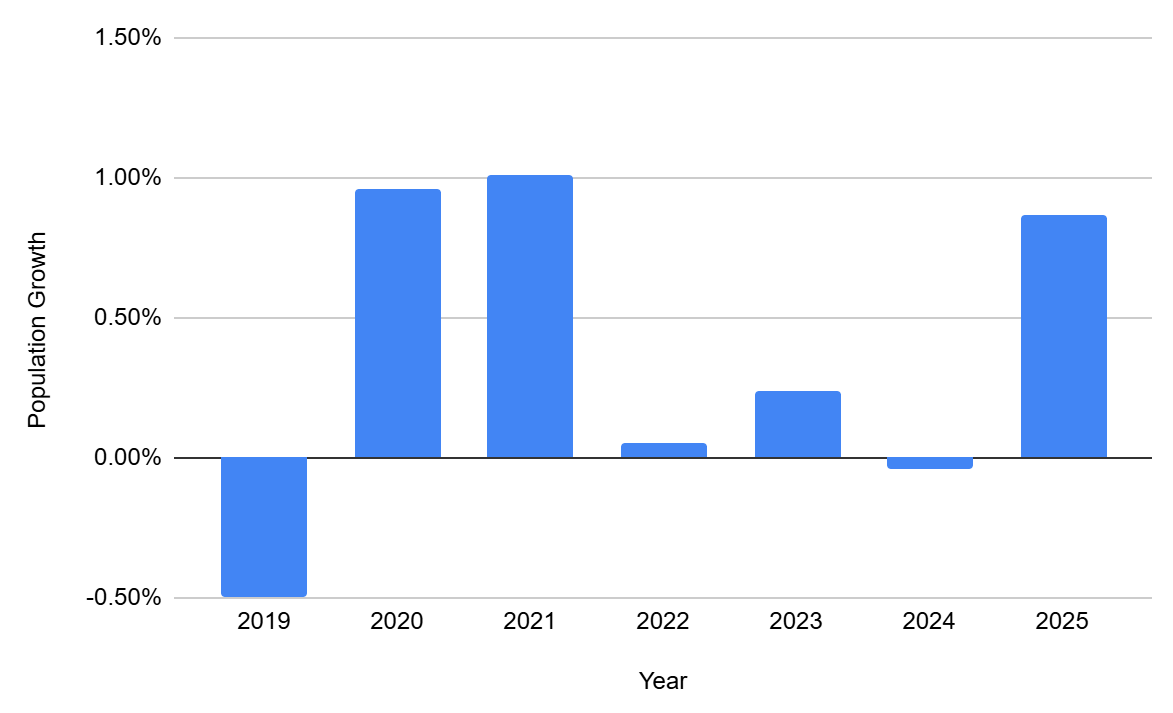
Figure 3 - Population Change in Surry County
References:
County Distress Rankings (Tiers). North Carolina Department of Commerce. Raleigh, NC. www.commerce.nc.gov Accessed March 6, 2025.
CPI Inflation Calculator. U.S. Bureau of Labor Statistics. Washington, DC. www.bls.gov Accessed March 6, 2025.
“Current US Inflation Rates: 2000-2025.” US Inflation Calculator. CoinNews Media Group Company. Helotes, TX. www.usinflationcalculator.com Accessed March 6, 2025.
Denning, Shea Riggsbee. “A Citizens’ Guide to the Revaluation and Assessment of Property by North Carolina Counties.” Property Tax Bulletin No. 144. The University of North Carolina at Chapel Hill. Chapel Hill, NC. 2008. www.sog.unc.edu Accessed March 6, 2025.
Koelling, C. Patrick, Sullivan, William G., Wicks, Elin M. Engineering Economy - 15th Ed. Pearson Education, Upper Saddle River, NJ. 2012.
“Surry County Board Retreat: Education.” Surry On The Go YouTube Channel. Surry On The Go. Dobson, NC. www.youtube.com/@SurryontheGo Accessed March 6, 2025.
51
The Issue
March 6, 2025
Greetings Commissioners of Surry County,
We are writing to you in regards to the drastic increase in property tax values across Surry County. Due to the decrease in the median household income, high inflation, and relatively high interest rates, we the people of Surry County feel that the new market values are somewhat unwarranted, and that factors outside of “market price” were not considered in the new evaluations.
As you are aware, Surry County has been designated a Tier 1 County for economic distress in 2025 by the North Carolina Department of Commerce, a change from the Tier 2 (less distressed) designation in 2024. The driving force for this change in designation was the decrease in the median household income (County Distress Rankings). As seen below in Figure 1, the Adjusted Property Tax Base Per Capita has been on a steady increase from 2019 to 2024, with an average rate of increase of 5.32% over five years, with a maximum increase of 7.12% in 2021. As also seen in Figure 1, that increase jumped in 2025, with a calculated percent increase of 14.1%, increasing the average to 7.51% over a five-year period (2020-2025). The Median Household Income between 2016 and 2022, had an average increase of 7.9%, with a maximum of 20.0% increase in 2017. We should note that we are using numbers from 2016-2022 since these are the same years used for the median household incomes in the NC Department of Commerce reports (County Distress Rankings).
The inflation rate for 2022 was approximately 6.5% (Current US Inflation Rates), and the total inflation rate from January 2016 to December 2022 was 23.0% (Current US Inflation Rates). The cost of living has continued to drastically increase over the past three years. According to the United States Bureau of Labor Statistics’ Consumer Price Index (CPI) Calculator, $100 in January of 2022 has the same buying power as $107.00 in January of 2025 (CPI Inflation Calculator). That is an additional increase of 7% over three years, or a total increase of 30% from 2016 to 2025. An additional increase to an already 30% more expensive cost of living, will put hardships on families as well as citizens on fixed incomes.
Using an equation that converts actual wages to real wages based on the inflation rate of that year (Koelling), as seen in Table 1 below, the real wage for 2022 is $34,207.51, compared to the actual wage of $48,524.00. This is $1,635.49, or 4.5%, lower than the actual and real median household income in 2016. When comparing the Adjusted Property Tax Base Per Capita to the Real Median Household Income, as seen in Figure 2 below, the trendlines diverge between the buying power of the citizens of Surry County and the tax values of their properties.
We are aware that the State Legislature requires properties to be re-evaluated every eight years at a minimum, and that property tax values have to be as close as possible to the actual market values in the time they are appraised (Denning). However, the market values of the homes and properties in Surry County are artificial. There is currently a real estate bubble. Interest rates are relatively high, compared to three to four years ago. Under normal circumstances, when interest rates rise, home prices decrease due to the decrease in demand. It is clear that this did not happen in Surry County. Interest rates rose, and in most cases, market prices of homes continued to increase. As can be found in the reports from the NC Department of Commerce, summarized in Figure 3 below, there has not been a surge in population growth in Surry County (County Distress Rankings). Since there has not been a drastic increase in the population of Surry County, there is not a real housing shortage. Due to higher interest rates, homeowners that bought their home two to three years ago are holding on to their homes to avoid buying another home at a higher interest rate and a higher price. This has created an artificial shortage and increased the “market value” of homes across the county. Additionally, a majority of the homes that had a significant increase in property tax value (i.e. greater than the 5.32% average between 2019-2024) were not physically upgraded/remodeled to warrant such an increase in value. This further proves that the “market values” listed on the property tax re-evaluations are artificial.
We understand that Surry County’s needs become increasingly expensive each year, such as the cost to build/renovate schools, increasing from $242 per square foot in 2020 to $402 per square foot in 2025 (Surry County Board of Retreat). We also realize that personnel, equipment, and maintenance costs increase each year for Surry County. We, as tax paying citizens of this County, do not want to hinder the County from efficiently performing the functions that it is meant to perform. Therefore, we request that the County re-evaluate the tax rates for each district and lower them so that the average increase in the Adjusted Property Tax Base Per Capita for 2025 is equal to 7% instead of the drastic 14.1%. We feel that this is the fairest resolution for both parties. This would still allow the County’s budget to increase, and unburden the citizens of Surry County from such a large increase in taxes, especially those with families and those who are on a fixed income.
Tables and Figures
Figure 1 - Adjusted Property Tax Base Per Capita vs Median Household Income
Table 1 - Adjusted Median Household Income for Inflation (Real Income)
Figure 2 - Adjusted Property Tax Base Per Capita vs. Real Median Household Income
Figure 3 - Population Change in Surry County
References:
County Distress Rankings (Tiers). North Carolina Department of Commerce. Raleigh, NC. www.commerce.nc.gov Accessed March 6, 2025.
CPI Inflation Calculator. U.S. Bureau of Labor Statistics. Washington, DC. www.bls.gov Accessed March 6, 2025.
“Current US Inflation Rates: 2000-2025.” US Inflation Calculator. CoinNews Media Group Company. Helotes, TX. www.usinflationcalculator.com Accessed March 6, 2025.
Denning, Shea Riggsbee. “A Citizens’ Guide to the Revaluation and Assessment of Property by North Carolina Counties.” Property Tax Bulletin No. 144. The University of North Carolina at Chapel Hill. Chapel Hill, NC. 2008. www.sog.unc.edu Accessed March 6, 2025.
Koelling, C. Patrick, Sullivan, William G., Wicks, Elin M. Engineering Economy - 15th Ed. Pearson Education, Upper Saddle River, NJ. 2012.
“Surry County Board Retreat: Education.” Surry On The Go YouTube Channel. Surry On The Go. Dobson, NC. www.youtube.com/@SurryontheGo Accessed March 6, 2025.
51
Petition Updates
Share this petition
Petition created on March 6, 2025